What this guide builds
Malware INFO Security Connectors can push selected, normalized security events to an organization-controlled SIEM, XDR, SOC collector, or HTTPS gateway. The outbound contract is vendor-neutral: malwareinfo.security-event/v1. Platform-specific parsing and indexing belong in the customer-controlled receiver or ingest pipeline, not in the Malware INFO workstation.
This article uses Wazuh because it is an accessible open-source platform for demonstrating the complete path. Malware INFO is not affiliated with, endorsed by, or sponsored by Wazuh. This is not an official or certified Wazuh integration, and Malware INFO Security Connectors are not limited to Wazuh.
In this example, Wazuh collects the receiver's flattened JSONL output through a Wazuh Agent, evaluates local custom rules, and displays the resulting alerts in its dashboard.
This guide builds and verifies that complete path with three computers:
- Computer 1 — Wazuh server: Wazuh Manager, Indexer, Dashboard, and custom Malware INFO rules.
- Computer 2 — Log server: Nginx, a small FastAPI receiver, durable JSONL logs, deduplication, and a Wazuh Agent.
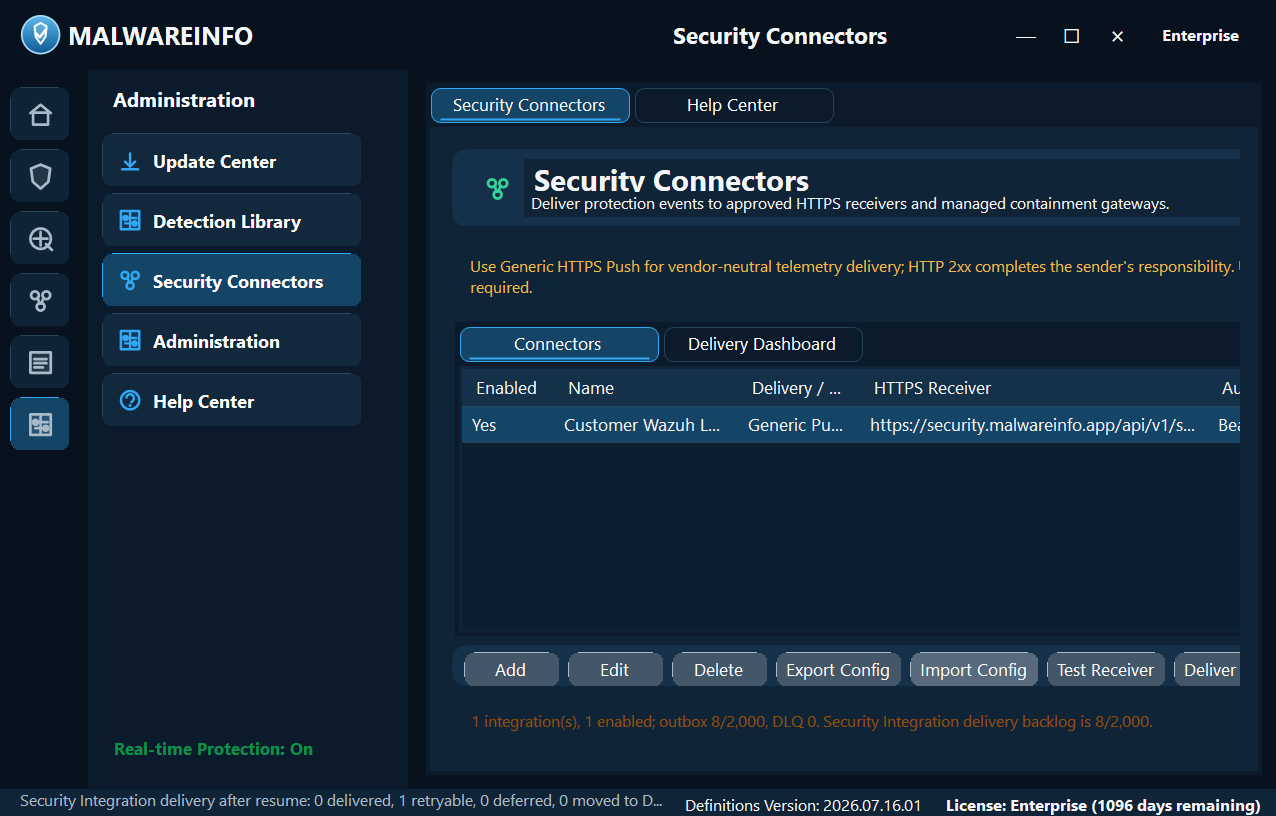
- Computer 3 — Malware INFO workstation: Malware INFO Enterprise with an outbound Generic HTTPS Push connector.
The tested flow is:
Malware INFO Workstation
        |
        | HTTPS POST /api/v1/security-events
        v
Nginx on the Log Server
        |
        | HTTP on 127.0.0.1:8090 only
        v
Malware INFO Receiver
        |
        | raw-events.jsonl + flattened wazuh-events.jsonl
        v
Wazuh Agent
        |
        | TCP 1514
        v
Wazuh Manager -> Indexer -> Dashboard
Malware INFO does not send events to the Wazuh REST API on port 55000. It is an outbound push sender, not an inbound SIEM server. The Log Server is the controlled integration boundary that authenticates the request, retains the raw event, filters selected findings, flattens fields for Wazuh, and passes only the Wazuh-ready JSONL stream to the Agent.
This is a practical single-node example of a vendor-neutral connector. It is not a production high-availability gateway, and Generic HTTPS Push does not prove downstream indexing or containment.
What is sent
The connector can publish:
- Confirmed Guard threats such as trusted hash, signature, or YARA detections.
- Guard zero-day heuristic alerts when that source is enabled.
- On-demand Zero-Day Scanner findings when that source is enabled.
- Optional normalized Guard file activity.
- Optional normalized Guard process activity.
- Optional normalized Guard network activity.
- Optional normalized Guard Registry activity.
- A harmless synthetic connectivity event from Test Receiver.
This reference receiver routes:
- Connectivity tests.
guard_confirmed_threatevents.guard_zero_dayandscanner_zero_dayevents at or above the configured score.- With strict mode enabled, only Critical zero-day events at or above that score.
- Each optional activity kind only when its matching receiver-side route is explicitly enabled.
The recommended shared evidence is:
- SHA-256 hashes.
- Validated malicious or suspicious IP, domain, and URL indicators.
- YARA match names, never complete private YARA source.
- Approved affected-computer IP addresses.
- Approved network context.
The optional activity sources are disabled by default. They send live normalized observations only; Malware INFO does not sweep or replay historical GuardFileActivity.jsonl, GuardProcessActivity.jsonl, GuardNetworkActivity.jsonl, or GuardRegistryActivity.jsonl lines. Each optional source is limited to 60 outbound events per minute. Excess observations remain in the local Guard log, and activity observations can never request automatic containment.
Treat each activity source as a separate disclosure decision:
- File activity — moderate risk: filenames, hashes, sizes, and operations can identify customer documents or software. Full local paths can reveal usernames, shares, and project structure.
- Process activity — moderate to high risk: process and parent names reveal software usage. The separate Process command line option is high risk because arguments may contain passwords, tokens, URLs, document names, or internal hosts.
- Network activity — high privacy and volume risk: endpoints, ports, timing, and connection state can reveal internal topology, remote services, and user activity.
- Registry activity — high risk: keys and value names reveal installed software and persistence locations. The separate Registry value data option may expose commands, user paths, license information, or secrets.
Do not use this integration to transfer complete files, quarantine payloads, memory dumps, API buffers, credentials, browser cookies, environment blocks, private YARA source, or other unapproved evidence.
Requirements and placeholders
The tested Wazuh side uses Wazuh 4.14.x on Ubuntu 24.04. Adjust package versions only after checking the current official Wazuh documentation.
Replace these placeholders throughout the guide:
WAZUH_MANAGER_IP: Computer 1's private address when both VPS systems have a protected private network, otherwise its public address.VPS2_PUBLIC_IP: Computer 2's public address.LOG_FQDN: A DNS name that resolves to Computer 2, for examplemi-log.example.com.ADMIN_PUBLIC_IP: The administrator's current public IPv4 address with/32firewall scope.WORKSTATION_PUBLIC_IP: The actual public egress address used by the Malware INFO workstation.
If the workstation uses a VPN, V2Ray, TUN mode, or another proxy, verify which public address the Malware INFO process actually uses. An allowlist containing the wrong VPS or proxy address will produce HTTP 403 or a timeout.
Firewall plan
Use both the hosting-provider firewall and the Ubuntu firewall. Do not assume one replaces the other.
Computer 1 needs:
- TCP 22 from
ADMIN_PUBLIC_IPfor SSH. - TCP 443 from
ADMIN_PUBLIC_IPfor the Wazuh Dashboard. - TCP 1514 from
VPS2_PUBLIC_IPfor Agent event communication. - TCP 1515 from
VPS2_PUBLIC_IPfor Agent enrollment.
Computer 2 needs:
- TCP 22 from
ADMIN_PUBLIC_IP. - TCP 80 from the Internet while using the Let's Encrypt HTTP challenge.
- TCP 443 from
WORKSTATION_PUBLIC_IP. - TCP 8090 only on loopback; never expose it publicly.
Do not expose Wazuh ports 55000, 9200, 9300, or cluster port 1516 to the Internet for this single-node test.
Computer 1: deploy Wazuh
For a small lab, begin with approximately four virtual CPUs, 8 GB of RAM, 50 GB or more of SSD storage, a static address, and working time synchronization.
Install the basic firewall and restrict management access:
sudo apt update
sudo apt install -y curl ufw

sudo ufw default deny incoming
sudo ufw default allow outgoing

sudo ufw allow from ADMIN_PUBLIC_IP to any port 22 proto tcp
sudo ufw allow from ADMIN_PUBLIC_IP to any port 443 proto tcp
sudo ufw allow from VPS2_PUBLIC_IP to any port 1514 proto tcp
sudo ufw allow from VPS2_PUBLIC_IP to any port 1515 proto tcp

sudo ufw enable
sudo ufw status numbered
Install the Wazuh all-in-one components:
curl -sO https://packages.wazuh.com/4.14/wazuh-install.sh
sudo bash ./wazuh-install.sh -a
Store the displayed Dashboard URL and administrator credential in an organization-approved password manager. Verify the services:
sudo systemctl status wazuh-manager
sudo systemctl status wazuh-indexer
sudo systemctl status wazuh-dashboard
sudo /var/ossec/bin/wazuh-control status
Configure password-authenticated Agent enrollment
Inside the existing <auth> block in /var/ossec/etc/ossec.conf, set:
<use_password>yes</use_password>Do not create a second <auth> block. Create a separate Agent enrollment password:
sudoedit /var/ossec/etc/authd.pass
sudo chown root:wazuh /var/ossec/etc/authd.pass
sudo chmod 640 /var/ossec/etc/authd.pass
sudo systemctl restart wazuh-manager
The Agent enrollment password is not the Wazuh Dashboard administrator password. Do not place either value in chat, tickets, shell history, screenshots, or public documentation.
Computer 2: prepare DNS, firewall, and the Wazuh Agent
Create a DNS A record:
LOG_FQDN -> VPS2_PUBLIC_IPUse DNS-only mode while validating the origin and obtaining the certificate. Configure Ubuntu:
sudo apt update
sudo apt install -y ufw

sudo ufw default deny incoming
sudo ufw default allow outgoing
sudo ufw allow from ADMIN_PUBLIC_IP to any port 22 proto tcp
sudo ufw allow 80/tcp
sudo ufw allow from WORKSTATION_PUBLIC_IP to any port 443 proto tcp
sudo ufw enable
Add the Wazuh package repository:
sudo apt install -y gnupg apt-transport-https curl

curl -s https://packages.wazuh.com/key/GPG-KEY-WAZUH |
  sudo gpg --no-default-keyring \
  --keyring gnupg-ring:/usr/share/keyrings/wazuh.gpg \
  --import

sudo chmod 644 /usr/share/keyrings/wazuh.gpg

echo "deb [signed-by=/usr/share/keyrings/wazuh.gpg] https://packages.wazuh.com/4.x/apt/ stable main" |
  sudo tee /etc/apt/sources.list.d/wazuh.list

sudo apt update
Read the enrollment password without putting it in command history:
read -rsp "Wazuh enrollment password: " ENROLL_PASS
echo

sudo env \
  WAZUH_MANAGER="WAZUH_MANAGER_IP" \
  WAZUH_REGISTRATION_SERVER="WAZUH_MANAGER_IP" \
  WAZUH_REGISTRATION_PASSWORD="$ENROLL_PASS" \
  WAZUH_AGENT_NAME="malwareinfo-logserver" \
  WAZUH_PROTOCOL="tcp" \
  apt-get install -y wazuh-agent

unset ENROLL_PASS

sudo systemctl daemon-reload
sudo systemctl enable --now wazuh-agent
sudo systemctl status wazuh-agent
sudo tail -n 100 /var/ossec/logs/ossec.log
If the package was already installed before those environment values were supplied, the installer may leave a literal placeholder such as WAZUH_MANAGER_IP in /var/ossec/etc/ossec.conf. Correct the Manager address, enroll manually with /var/ossec/bin/agent-auth, and restart the Agent.
In the Wazuh Dashboard, malwareinfo-logserver must appear as Active under Agent management.
Build the restricted HTTPS receiver
Install the dependencies and create a non-login service account:
sudo apt install -y python3-venv nginx certbot jq

sudo useradd \
  --system \
  --no-create-home \
  --home-dir /nonexistent \
  --shell /usr/sbin/nologin \
  --gid wazuh \
  mi-receiver

sudo install -d -o root -g wazuh -m 0750 /opt/malwareinfo-receiver
sudo install -d -o mi-receiver -g wazuh -m 0750 /var/log/malwareinfo
sudo install -d -o mi-receiver -g wazuh -m 0750 /var/lib/malwareinfo-receiver

sudo python3 -m venv /opt/malwareinfo-receiver/venv
sudo /opt/malwareinfo-receiver/venv/bin/pip install --upgrade pip
sudo /opt/malwareinfo-receiver/venv/bin/pip install fastapi uvicorn
Create /opt/malwareinfo-receiver/receiver.py. The reference receiver:
- Uses constant-time Bearer-token comparison.
- Accepts only
application/json. - Limits the request body to 1 MiB.
- Requires the fixed
malwareinfo.security-event/v1schema. - Verifies the schema and idempotency headers.
- Deduplicates by
eventIdin SQLite. - Preserves every accepted event in a raw JSONL record.
- Routes test, confirmed, selected Zero-Day, and explicitly enabled activity events to Wazuh.
- Converts indicator objects into flat string arrays for predictable Wazuh fields.
- Preserves the already privacy-filtered
activityobject for platform-side field mapping.
import hmac
import json
import os
import re
import sqlite3
import threading
from datetime import datetime, timezone
from pathlib import Path

from fastapi import FastAPI, HTTPException, Request, Response

TOKEN = os.environ.get("MI_BEARER_TOKEN", "")
MIN_ZERO_DAY_SCORE = int(os.environ.get("MI_MIN_ZERO_DAY_SCORE", "80"))
STRICT_ZERO_DAY = os.environ.get("MI_STRICT_ZERO_DAY", "true").lower() in {
    "1", "true", "yes"
}
ROUTE_GUARD_ZERO_DAY = os.environ.get(
    "MI_ROUTE_GUARD_ZERO_DAY", "true"
).lower() in {"1", "true", "yes"}
ACTIVITY_ROUTES = {
    "guard_file_activity": os.environ.get(
        "MI_ROUTE_FILE_ACTIVITY", "false"
    ).lower() in {"1", "true", "yes"},
    "guard_process_activity": os.environ.get(
        "MI_ROUTE_PROCESS_ACTIVITY", "false"
    ).lower() in {"1", "true", "yes"},
    "guard_network_activity": os.environ.get(
        "MI_ROUTE_NETWORK_ACTIVITY", "false"
    ).lower() in {"1", "true", "yes"},
    "guard_registry_activity": os.environ.get(
        "MI_ROUTE_REGISTRY_ACTIVITY", "false"
    ).lower() in {"1", "true", "yes"},
}

MAX_BODY = 1024 * 1024
RAW_LOG = Path("/var/log/malwareinfo/raw-events.jsonl")
WAZUH_LOG = Path("/var/log/malwareinfo/wazuh-events.jsonl")
DB_PATH = Path("/var/lib/malwareinfo-receiver/events.sqlite")
EVENT_ID_RE = re.compile(r"^event--[A-Za-z0-9._-]+$")
LOCK = threading.Lock()

if len(TOKEN) < 32:
    raise RuntimeError("MI_BEARER_TOKEN must contain at least 32 characters")

app = FastAPI(docs_url=None, redoc_url=None, openapi_url=None)


def utc_now() -> str:
    return datetime.now(timezone.utc).isoformat().replace("+00:00", "Z")


def as_object(value):
    return value if isinstance(value, dict) else {}


def string_list(value):
    if not isinstance(value, list):
        return []
    return [item for item in value if isinstance(item, str)][:64]


def append_jsonl(path: Path, value: dict) -> None:
    line = json.dumps(value, ensure_ascii=False, separators=(",", ":")) + "\n"
    with path.open("a", encoding="utf-8") as handle:
        handle.write(line)
        handle.flush()
        os.fsync(handle.fileno())


def initialize_database() -> None:
    DB_PATH.parent.mkdir(parents=True, exist_ok=True)
    with sqlite3.connect(DB_PATH) as db:
        db.execute("PRAGMA journal_mode=WAL")
        db.execute(
            """
            CREATE TABLE IF NOT EXISTS events (
                event_id TEXT PRIMARY KEY,
                received_at TEXT NOT NULL,
                routed INTEGER NOT NULL,
                routing_reason TEXT NOT NULL
            )
            """
        )


def flatten_for_wazuh(event: dict, received_at: str, reason: str) -> dict:
    sensor = as_object(event.get("sensor"))
    asset = as_object(event.get("asset"))
    threat = as_object(event.get("threat"))
    network = as_object(event.get("network"))
    activity = as_object(event.get("activity"))
    indicators = {
        "sha256": [],
        "ipv4": [],
        "ipv6": [],
        "domain": [],
        "url": [],
        "yara_rule_name": [],
    }

    for item in threat.get("indicators", []):
        if not isinstance(item, dict):
            continue
        indicator_type = item.get("type")
        value = item.get("value")
        if indicator_type in indicators and isinstance(value, str):
            if value not in indicators[indicator_type]:
                indicators[indicator_type].append(value)

    return {
        "schema": "malwareinfo.wazuh-event/v1",
        "sourceSchema": event.get("schema"),
        "eventId": event.get("eventId"),
        "occurredAtUtc": event.get("occurredAtUtc"),
        "receivedAtUtc": received_at,
        "eventKind": event.get("eventKind"),
        "severity": event.get("severity"),
        "confidence": event.get("confidence"),
        "source": event.get("source"),
        "sensor": {
            "product": sensor.get("product"),
            "version": sensor.get("version"),
            "module": sensor.get("module"),
        },
        "asset": {
            "deviceId": asset.get("deviceId"),
            "hostName": asset.get("hostName"),
            "ipAddresses": string_list(asset.get("ipAddresses")),
        },
        "threat": {
            "name": threat.get("name"),
            "engine": threat.get("engine"),
            "summary": threat.get("summary"),
            "score": threat.get("score"),
            "fileName": threat.get("fileName"),
            "fileSize": threat.get("fileSize"),
            "localAction": threat.get("localAction"),
            "sha256": indicators["sha256"],
            "ipv4": indicators["ipv4"],
            "ipv6": indicators["ipv6"],
            "domain": indicators["domain"],
            "url": indicators["url"],
            "yaraRuleName": indicators["yara_rule_name"],
            "mitreTactics": string_list(threat.get("mitreTactics")),
            "mitreTechniques": string_list(threat.get("mitreTechniques")),
        },
        "network": network,
        "activity": {
            "category": activity.get("category"),
            "operation": activity.get("operation"),
            "decision": activity.get("decision"),
            "reason": activity.get("reason"),
            "observationKind": activity.get("observationKind"),
            "processName": activity.get("processName"),
            "parentProcessName": activity.get("parentProcessName"),
            "commandLine": activity.get("commandLine"),
            "registryHive": activity.get("registryHive"),
            "registryKeyPath": activity.get("registryKeyPath"),
            "registryValueName": activity.get("registryValueName"),
            "registryValueData": activity.get("registryValueData"),
        },
        "routing": {
            "reason": reason,
            "minimumZeroDayScore": MIN_ZERO_DAY_SCORE,
            "strictZeroDay": STRICT_ZERO_DAY,
        },
    }


initialize_database()


@app.get("/health")
async def health():
    return {"status": "ok"}


@app.post("/api/v1/security-events")
async def receive_event(request: Request):
    supplied_auth = request.headers.get("authorization", "")
    if not hmac.compare_digest(supplied_auth, f"Bearer {TOKEN}"):
        raise HTTPException(status_code=401, detail="Unauthorized")

    content_type = request.headers.get("content-type", "").split(";")[0].lower()
    if content_type != "application/json":
        raise HTTPException(status_code=415, detail="application/json required")

    raw_body = await request.body()
    if len(raw_body) > MAX_BODY:
        raise HTTPException(status_code=413, detail="Payload too large")

    try:
        event = json.loads(raw_body)
    except (UnicodeDecodeError, json.JSONDecodeError):
        raise HTTPException(status_code=400, detail="Invalid JSON")

    if not isinstance(event, dict):
        raise HTTPException(status_code=400, detail="JSON object required")
    if event.get("schema") != "malwareinfo.security-event/v1":
        raise HTTPException(status_code=400, detail="Unsupported schema")
    if request.headers.get("x-malwareinfo-schema") != event.get("schema"):
        raise HTTPException(status_code=400, detail="Schema header mismatch")

    event_id = event.get("eventId")
    if not isinstance(event_id, str) or not EVENT_ID_RE.fullmatch(event_id):
        raise HTTPException(status_code=400, detail="Invalid eventId")
    if request.headers.get("idempotency-key") != event_id:
        raise HTTPException(status_code=400, detail="Idempotency-Key mismatch")

    event_kind = event.get("eventKind")
    severity = event.get("severity")
    threat = as_object(event.get("threat"))
    score = threat.get("score")
    local_action = threat.get("localAction")

    is_test = (
        local_action == "TestOnly"
        and str(event.get("source", "")).startswith("MalwareInfo")
    )
    is_confirmed = event_kind == "guard_confirmed_threat"
    confidence = event.get("confidence")
    numeric_score = (
        float(score)
        if type(score) in (int, float)
        else float(confidence)
        if type(confidence) in (int, float)
        else -1
    )
    is_selected_zero_day = (
        event_kind in {"guard_zero_day", "scanner_zero_day"}
        and (event_kind != "guard_zero_day" or ROUTE_GUARD_ZERO_DAY)
        and numeric_score >= MIN_ZERO_DAY_SCORE
        and (not STRICT_ZERO_DAY or severity == "critical")
    )
    is_selected_activity = ACTIVITY_ROUTES.get(event_kind, False)

    if is_test:
        routed, reason = True, "malwareinfo_connectivity_test"
    elif is_confirmed:
        routed, reason = True, "guard_confirmed_threat"
    elif is_selected_zero_day:
        routed, reason = True, f"{event_kind}_selected"
    elif is_selected_activity:
        routed, reason = True, f"{event_kind}_enabled"
    else:
        routed, reason = False, "stored_but_filtered"

    received_at = utc_now()
    raw_record = {
        "receivedAtUtc": received_at,
        "routedToWazuh": routed,
        "routingReason": reason,
        "event": event,
    }

    with LOCK:
        db = sqlite3.connect(DB_PATH)
        try:
            existing = db.execute(
                "SELECT 1 FROM events WHERE event_id = ?", (event_id,)
            ).fetchone()
            if existing:
                return Response(status_code=204)

            append_jsonl(RAW_LOG, raw_record)
            if routed:
                append_jsonl(
                    WAZUH_LOG,
                    flatten_for_wazuh(event, received_at, reason),
                )
            db.execute(
                """
                INSERT INTO events
                    (event_id, received_at, routed, routing_reason)
                VALUES (?, ?, ?, ?)
                """,
                (event_id, received_at, int(routed), reason),
            )
            db.commit()
        finally:
            db.close()

    return Response(status_code=204)
Protect the source:
sudo chown root:wazuh /opt/malwareinfo-receiver/receiver.py
sudo chmod 640 /opt/malwareinfo-receiver/receiver.py
Configure the token and service
Generate a 64-character token and transfer it to the workstation through an approved secret channel:
openssl rand -hex 32
sudoedit /etc/malwareinfo-receiver.env
The environment file contains:
MI_BEARER_TOKEN=PASTE_64_CHARACTER_TOKEN_HERE
MI_MIN_ZERO_DAY_SCORE=80
MI_STRICT_ZERO_DAY=true
MI_ROUTE_GUARD_ZERO_DAY=true
MI_ROUTE_FILE_ACTIVITY=false
MI_ROUTE_PROCESS_ACTIVITY=false
MI_ROUTE_NETWORK_ACTIVITY=false
MI_ROUTE_REGISTRY_ACTIVITY=false
Leave all four activity routes false for the first deployment. Enabling an activity source in Malware INFO authorizes the workstation to send it; enabling the matching receiver route is a second independent decision to index it in this Wazuh example. The raw receiver log still contains every event accepted from an enabled connector, so apply the same access and retention controls to raw-events.jsonl.
Protect the environment file:
sudo chown root:root /etc/malwareinfo-receiver.env
sudo chmod 600 /etc/malwareinfo-receiver.env
sudoedit /etc/systemd/system/malwareinfo-receiver.service
Use this restricted service definition:
[Unit]
Description=MalwareInfo HTTPS Security Event Receiver
After=network-online.target
Wants=network-online.target

[Service]
Type=simple
User=mi-receiver
Group=wazuh
WorkingDirectory=/opt/malwareinfo-receiver
EnvironmentFile=/etc/malwareinfo-receiver.env
Environment=PYTHONDONTWRITEBYTECODE=1
ExecStart=/opt/malwareinfo-receiver/venv/bin/uvicorn receiver:app --host 127.0.0.1 --port 8090 --workers 1
Restart=on-failure
RestartSec=3
UMask=0027
NoNewPrivileges=yes
PrivateTmp=yes
PrivateDevices=yes
ProtectSystem=strict
ProtectHome=yes
ProtectKernelTunables=yes
ProtectControlGroups=yes
ReadWritePaths=/var/log/malwareinfo /var/lib/malwareinfo-receiver

[Install]
WantedBy=multi-user.target
Start and test it:
sudo systemctl daemon-reload
sudo systemctl enable --now malwareinfo-receiver
sleep 3
sudo systemctl status malwareinfo-receiver --no-pager
curl http://127.0.0.1:8090/health
The expected response is:
{"status":"ok"}The short delay avoids testing Uvicorn before application startup completes.
Add Nginx and a trusted TLS certificate
First create an HTTP-only site at /etc/nginx/sites-available/malwareinfo-receiver:
server {
    listen 80;
    listen [::]:80;
    server_name LOG_FQDN;
    root /var/www/html;

    location ^~ /.well-known/acme-challenge/ {
        try_files $uri =404;
    }

    location / {
        return 404;
    }
}
Enable it, validate Nginx, and obtain the certificate:
sudo ln -s /etc/nginx/sites-available/malwareinfo-receiver \
  /etc/nginx/sites-enabled/malwareinfo-receiver

sudo nginx -t
sudo systemctl reload nginx

sudo certbot certonly \
  --webroot \
  --webroot-path /var/www/html \
  --domain LOG_FQDN
After the certificate exists, replace the file with the final configuration:
limit_req_zone $binary_remote_addr zone=malwareinfo_rate:10m rate=5r/s;

server {
    listen 80;
    listen [::]:80;
    server_name LOG_FQDN;
    root /var/www/html;

    location ^~ /.well-known/acme-challenge/ {
        try_files $uri =404;
    }

    location / {
        return 301 https://$host$request_uri;
    }
}

server {
    listen 443 ssl;
    listen [::]:443 ssl;
    server_name LOG_FQDN;

    ssl_certificate /etc/letsencrypt/live/LOG_FQDN/fullchain.pem;
    ssl_certificate_key /etc/letsencrypt/live/LOG_FQDN/privkey.pem;
    ssl_protocols TLSv1.2 TLSv1.3;

    client_max_body_size 1m;

    location = /api/v1/security-events {
        allow WORKSTATION_PUBLIC_IP;
        deny all;

        limit_except POST {
            deny all;
        }

        limit_req zone=malwareinfo_rate burst=10 nodelay;

        proxy_pass http://127.0.0.1:8090;
        proxy_http_version 1.1;
        proxy_set_header Host $host;
        proxy_set_header X-Forwarded-Proto https;
        proxy_set_header X-Forwarded-For $proxy_add_x_forwarded_for;
        proxy_connect_timeout 3s;
        proxy_read_timeout 10s;
    }

    location / {
        return 404;
    }
}
Validate and reload:
sudo nginx -t
sudo systemctl reload nginx
sudo certbot renew --dry-run
The application on port 8090 remains bound to 127.0.0.1. Only Nginx receives Internet traffic.
Tell the Wazuh Agent to collect the flattened JSONL
Create the file with permissions readable by the Agent:
sudo install \
  -o mi-receiver \
  -g wazuh \
  -m 0640 \
  /dev/null \
  /var/log/malwareinfo/wazuh-events.jsonl
Add this <localfile> entry inside an <ossec_config> block in /var/ossec/etc/ossec.conf:
<localfile>
  <location>/var/log/malwareinfo/wazuh-events.jsonl</location>
  <log_format>json</log_format>
  <only-future-events>yes</only-future-events>
  <label key="@collector">malwareinfo-security-connector</label>
</localfile>
Restart the Agent:
sudo systemctl restart wazuh-agent
sudo tail -n 100 /var/ossec/logs/ossec.log
Confirm that the log includes:
Analyzing file: '/var/log/malwareinfo/wazuh-events.jsonl'Because only-future-events is enabled, an event that already existed before the Agent began monitoring is not replayed. Restart the Agent first, then send a new Test Receiver event.
Add custom Malware INFO rules on the Wazuh Manager
Create /var/ossec/etc/rules/malwareinfo_rules.xml:
<group name="malwareinfo,">

  <rule id="100500" level="0">
    <decoded_as>json</decoded_as>
    <field name="schema">^malwareinfo\.wazuh-event/v1$</field>
    <description>MalwareInfo security event received</description>
  </rule>

  <rule id="100501" level="3">
    <if_sid>100500</if_sid>
    <field name="threat.localAction">^TestOnly$</field>
    <description>MalwareInfo connector test from $(asset.hostName)</description>
    <group>malwareinfo_test,</group>
  </rule>

  <rule id="100510" level="12">
    <if_sid>100500</if_sid>
    <field name="eventKind">^guard_confirmed_threat$</field>
    <description>MalwareInfo confirmed threat: $(threat.name) on $(asset.hostName)</description>
    <group>malware,confirmed_threat,</group>
  </rule>

  <rule id="100511" level="15">
    <if_sid>100510</if_sid>
    <field name="severity">^critical$</field>
    <description>MalwareInfo critical confirmed threat: $(threat.name) on $(asset.hostName)</description>
    <group>malware,critical,confirmed_threat,</group>
  </rule>

  <rule id="100520" level="12">
    <if_sid>100500</if_sid>
    <field name="eventKind">^scanner_zero_day$</field>
    <field name="severity">^high$</field>
    <description>MalwareInfo high-suspicion scanner finding: $(threat.name) on $(asset.hostName)</description>
    <group>malware,suspected_zero_day,</group>
  </rule>

  <rule id="100521" level="15">
    <if_sid>100500</if_sid>
    <field name="eventKind">^scanner_zero_day$</field>
    <field name="severity">^critical$</field>
    <description>MalwareInfo critical suspected zero-day: $(threat.name) on $(asset.hostName)</description>
    <group>malware,critical,suspected_zero_day,</group>
  </rule>

  <rule id="100522" level="12">
    <if_sid>100500</if_sid>
    <field name="eventKind">^guard_zero_day$</field>
    <field name="severity">^high$</field>
    <description>MalwareInfo high-risk Guard finding: $(threat.name) on $(asset.hostName)</description>
    <group>malware,suspected_zero_day,</group>
  </rule>

  <rule id="100523" level="15">
    <if_sid>100500</if_sid>
    <field name="eventKind">^guard_zero_day$</field>
    <field name="severity">^critical$</field>
    <description>MalwareInfo critical Guard finding: $(threat.name) on $(asset.hostName)</description>
    <group>malware,critical,suspected_zero_day,</group>
  </rule>

  <rule id="100530" level="3">
    <if_sid>100500</if_sid>
    <field name="eventKind">^guard_file_activity$</field>
    <description>MalwareInfo optional file activity on $(asset.hostName)</description>
    <group>malwareinfo_activity,file_activity,</group>
  </rule>

  <rule id="100531" level="3">
    <if_sid>100500</if_sid>
    <field name="eventKind">^guard_process_activity$</field>
    <description>MalwareInfo optional process activity on $(asset.hostName)</description>
    <group>malwareinfo_activity,process_activity,</group>
  </rule>

  <rule id="100532" level="3">
    <if_sid>100500</if_sid>
    <field name="eventKind">^guard_network_activity$</field>
    <description>MalwareInfo optional network activity on $(asset.hostName)</description>
    <group>malwareinfo_activity,network_activity,</group>
  </rule>

  <rule id="100533" level="3">
    <if_sid>100500</if_sid>
    <field name="eventKind">^guard_registry_activity$</field>
    <description>MalwareInfo optional Registry activity on $(asset.hostName)</description>
    <group>malwareinfo_activity,registry_activity,</group>
  </rule>

</group>
Rules 100530–100533 deliberately use a low informational level. Optional activity is telemetry, not a malware verdict. Raise levels only for independently defined receiver-side detection logic that uses adequate evidence and documented false-positive handling.
Test before restarting the Manager:
sudo /var/ossec/bin/wazuh-logtestPaste a single flattened JSON line, not an echo command. A safe manual connectivity test is:
{"schema":"malwareinfo.wazuh-event/v1","eventId":"event--manual-test-001","eventKind":"connector_test","severity":"informational","source":"MalwareInfo Manual Test","asset":{"hostName":"test-workstation"},"threat":{"name":"Connector Test","localAction":"TestOnly"}}The expected filtering result includes:
id: '100501'
level: '3'
description: 'MalwareInfo connector test from test-workstation'
Alert to be generated.
Exit with Ctrl+C, then activate the rules:
sudo systemctl restart wazuh-manager
sudo systemctl status wazuh-manager --no-pager
Computer 3: configure Malware INFO
On the Windows workstation, verify DNS and TLS:
Resolve-DnsName LOG_FQDN
Test-NetConnection LOG_FQDN -Port 443
Run Malware INFO as Administrator and open Security Connectors > Add.
Use these settings:
- Name: Customer Wazuh Lab
- Delivery profile: Generic HTTPS Push
- Event endpoint:
https://LOG_FQDN/api/v1/security-events - Capabilities API: Blank
- Payload: Malware INFO JSON v1
- Authentication: Bearer token
- Credential / secret: The 64-character token created on Computer 2
- OAuth token API / scope: Blank
- Client certificate: Off for the first Bearer-token test
- Enabled: On after testing
- Require capability negotiation: Off
- Containment: Notify only
Select only the approved event sources:
- Guard confirmed threats.
- Guard zero-day heuristic alerts when the receiver policy accepts them.
- On-demand Zero-Day Scanner findings.
- Optional Guard file activity only when its moderate privacy and volume risk is accepted.
- Optional Guard process activity only when software-usage telemetry is authorized.
- Optional Guard network activity only when topology, service, and connection telemetry is authorized.
- Optional Guard Registry activity only when configuration and persistence telemetry is authorized.
Recommended evidence selections are SHA-256, validated network indicators, YARA match name, and approved affected-computer IP addresses. Keep Local file path, Process command line, and Registry value data disabled unless the organization explicitly approves the exact disclosure and the receiving platform's access and retention policy.
The activity options are independent and default to Off. Selecting one does not send old JSONL history; only new live observations enter the protected outbox. Malware INFO caps each optional activity source at 60 outbound events per minute and records a local diagnostic when that limit is reached.
For Generic HTTPS Push, any HTTP 2xx response completes Malware INFO's sender responsibility. It does not claim that Wazuh indexed the event or that a firewall blocked anything.
Verify the complete event path
Select the saved connector and choose Test Receiver. The expected result is HTTP 204 or another 2xx.
On Computer 2:
sudo journalctl -u malwareinfo-receiver -n 100 --no-pager
sudo tail -n 1 /var/log/malwareinfo/raw-events.jsonl | jq .
sudo tail -n 1 /var/log/malwareinfo/wazuh-events.jsonl | jq .
sudo tail -n 100 /var/ossec/logs/ossec.log
Both JSONL files should gain a new line. The Agent must remain Active.
In the Wazuh Dashboard, open Discover, select the wazuh-alerts-* data view, widen the time range, and search:
rule.id:100501Seeing rule 100501 proves this complete route:
Workstation -> HTTPS -> Nginx -> Receiver -> JSONL -> Agent -> Manager rule -> Indexer -> DashboardFind real Malware INFO threats in Wazuh
Use this query for non-test Malware INFO threat alerts while excluding optional activity telemetry:
rule.groups:malwareinfo AND NOT rule.id:100501 AND NOT rule.groups:malwareinfo_activityConfirmed Guard threats:
rule.id:100510 OR rule.id:100511Selected Zero-Day findings:
rule.id:100520 OR rule.id:100521 OR rule.id:100522 OR rule.id:100523Optional activity observations:
rule.id:100530 OR rule.id:100531 OR rule.id:100532 OR rule.id:100533Only optional activity, separated from malware alerts:
rule.groups:malwareinfo_activitySearch a partial threat or family name:
data.threat.name:*Trojan*Search an exact threat name:
data.threat.name:"Exact threat name"Search by SHA-256:
data.threat.sha256:"SHA256_VALUE"Search one affected workstation:
data.asset.hostName:"WORKSTATION_NAME"Expand a result to review:
data.threat.namedata.threat.sha256data.threat.scoredata.severitydata.asset.hostNamedata.threat.fileNamedata.threat.localActiondata.eventKinddata.activity.categorydata.activity.operationdata.activity.decisiondata.activity.processNamerule.description
Save rule.groups:malwareinfo AND NOT rule.id:100501 AND NOT rule.groups:malwareinfo_activity as MalwareInfo Real Threats for routine SOC use. Keep optional activity in a separate saved search so informational telemetry does not obscure threat detections.
Adjust the Zero-Day routing policy
The strict reference policy is:
MI_MIN_ZERO_DAY_SCORE=80
MI_STRICT_ZERO_DAY=true
MI_ROUTE_GUARD_ZERO_DAY=true
This retains all accepted events in the raw log but forwards only Critical Guard or Scanner Zero-Day findings with score or confidence 80 or higher to Wazuh.
To route High Suspicion findings at score 70 or higher:
MI_MIN_ZERO_DAY_SCORE=70
MI_STRICT_ZERO_DAY=false
Then restart:
sudo systemctl restart malwareinfo-receiverChanging this policy increases alert volume and must be agreed with the receiving SOC team.
Optional activity uses separate receiver switches. For example, to route file and process activity but keep network and Registry activity out of the Wazuh-ready stream:
MI_ROUTE_FILE_ACTIVITY=true
MI_ROUTE_PROCESS_ACTIVITY=true
MI_ROUTE_NETWORK_ACTIVITY=false
MI_ROUTE_REGISTRY_ACTIVITY=false
Restart the receiver after changing these values. These switches do not override the workstation: an activity kind is sent only when that connector's matching checkbox is also enabled.
Troubleshooting
Test Receiver returns HTTP 401
The Bearer token does not match. Compare the protected receiver environment value with the Malware INFO connector credential. Never paste the real token into logs or support tickets.
Test Receiver returns HTTP 403
Nginx or the hosting firewall rejected the source address. Confirm the workstation's actual public egress IP, especially when a VPN or proxy is active.
HTTP 404
Confirm the exact endpoint:
https://LOG_FQDN/api/v1/security-eventsThe root path intentionally returns 404.
HTTP 413
The payload exceeded the Nginx or receiver 1 MiB limit. Do not increase limits without reviewing the contract and abuse risk.
HTTP 204 but no Wazuh alert
Check these boundaries separately:
- Did
raw-events.jsonlgain a line? - Did
wazuh-events.jsonlgain a line? - Did the event pass the strict routing policy?
- Did the Agent begin monitoring before the event arrived?
- Is
malwareinfo-logserverActive? - Does the exact flattened line match the custom rule in
wazuh-logtest? - Is the Dashboard time range wide enough?
Useful Computer 2 diagnostics:
sudo systemctl status malwareinfo-receiver
sudo journalctl -u malwareinfo-receiver -f
sudo nginx -t
sudo systemctl status nginx
sudo systemctl status wazuh-agent
sudo tail -f /var/ossec/logs/ossec.log
Useful Computer 1 diagnostics:
sudo systemctl status wazuh-manager
sudo /var/ossec/bin/wazuh-control status
sudo /var/ossec/bin/wazuh-logtest
sudo /var/ossec/bin/agent_control -lc
sudo tail -f /var/ossec/logs/ossec.log
On the workstation, review the connector's Enabled and authorization state, Delivery Dashboard Pending/Retry/DLQ values, the exact HTTPS endpoint, event sources, and the local SecurityIntegrations.log.
Production hardening
Before production use:
- Put the Wazuh Manager and Log Server on a protected private network when possible.
- Replace broad firewall rules with exact source addresses.
- Consider mTLS and verify the client certificate at Nginx.
- Keep the receiver bound to loopback.
- Rotate Bearer tokens and document ownership.
- Add JSONL log rotation, retention, backup, disk-usage alerts, and access auditing.
- Monitor SQLite and outbox growth.
- Keep optional activity sources disabled until privacy, access, indexing volume, and retention are approved.
- Keep process command line and Registry value data disabled unless a documented need outweighs their secret-disclosure risk.
- Store activity telemetry separately from confirmed malware alerts and tune its retention independently.
- Add availability monitoring for Nginx, the receiver, Wazuh Agent, Manager, Indexer, and Dashboard.
- Test restore and disaster-recovery procedures.
- Preserve idempotency by
eventId. - Never treat affected asset IP addresses as malicious block targets.
- Keep Generic HTTPS Push at Notify only.
- Use a separately designed Managed Gateway with strict acknowledgements, approval, idempotency, rollback, and action-result auditing if containment is required.
The reference receiver is intentionally small and understandable. A production multi-node service needs a shared durable idempotency store, high availability, managed secrets, centralized monitoring, documented change control, and a tested upgrade path.
Success criteria
The integration is working when all of these are true:
- Test Receiver returns HTTP 2xx.
- The raw JSONL file receives the event.
- The selected/flattened JSONL file receives the routed event.
- The Wazuh Agent is Active and monitoring that file.
- The connectivity test appears as rule 100501.
- Confirmed Guard threats appear as rule 100510 or 100511.
- Selected Critical Zero-Day Scanner findings appear as rule 100521 under the strict policy.
- Selected Critical Guard Zero-Day findings appear as rule 100523 under the strict policy.
- Any enabled optional activity appears only under rules 100530–100533 and is clearly classified as informational telemetry.
- The Dashboard exposes the threat name, hash, severity, source workstation, and event kind.
- No file content, credential, command line, Registry value data, or other unapproved private evidence is shared.
Official references
- Wazuh Quickstart
- Wazuh architecture and required ports
- Deploying Wazuh Agents on Linux
- Wazuh local file collection
- Wazuh JSON decoder
- Wazuh custom rules
Wazuh versions, Ubuntu support, package URLs, and configuration details change over time. Re-check the official documentation before a new production deployment.